
The PCBA Unit Price Curve: Why Piece Price Drops — And Where It Stops
Opening Introduction
QUICK ANSWER
PCBA piece price falls because it is the sum of three cost layers that amortise at different speeds: one-time engineering cost, which collapses fastest and approaches zero per board; component purchase tiers, which step down at fixed quantity breakpoints; and line efficiency and yield, which improves slowly at roughly 10–20% per doubling of cumulative output. The price stops falling when what remains is the material you cannot avoid — the BOM, the laminate, the solder paste. On a typical 200-component, four-layer board, roughly 70–80% of the total available reduction is already captured by about 1,000 to 2,500 units. Past that point, each further doubling of order quantity typically buys single-digit percent.
Ask for a quote at 100 pieces, then ask again at 1,000. The board is identical. The BOM is identical. Nobody touched the design. Yet the piece price comes back at roughly half — and if you are new to hardware sourcing, that number looks like a mistake, or a discount you did not negotiate.
Then you ask about 10,000, expecting the same jump, and the answer barely moves.
That second response is where most buyers get stuck. The industry explains volume pricing with a list — NRE, components, efficiency — and stops there. Nobody shows you the order in which those three things stop working, or the quantity at which further volume stops being worth chasing. So a buyer ends up negotiating the same lever (more units) long after that lever has stopped paying, while the levers that still work go untouched.
This guide draws the curve properly. Three layers, the sequence in which each one flattens, and the point on the x-axis where your money is better spent somewhere other than quantity.
The PCBA price curve is not one curve. It is three
A PCBA unit price curve is the sum of three independent cost behaviours — one-time engineering amortisation, component quantity price breaks, and manufacturing learning — each of which flattens at a different order quantity. The total curve is therefore not a smooth exponential decay; it is the superposition of three curves that stop falling at three different points.
This matters because it changes what “getting a better price” means at each stage of your program. At 50 units you are negotiating engineering cost. At 500 you are negotiating component tier pricing. At 5,000 you are negotiating yield, and only the design can help you.
| Cost layer | What it contains | Shape of its curve | Stops falling when | Share of the drop |
|---|---|---|---|---|
| 1. One-time engineering (NRE) | Stencil, programming, reflow profile, test fixture, first-article inspection | Hyperbolic — fixed cost ÷ quantity | By roughly 500–1,000 units it is effectively gone | 25–45% at low volumes |
| 2. Component purchase | Every BOM line at its distributor or manufacturer tier price | Staircase — steps at each breakpoint | At the manufacturer’s own floor, often 10k–100k pieces per part | 30–50% on BOM-heavy designs |
| 3. Line efficiency and yield | Changeover time, machine utilisation, first-pass yield, rework | Log-linear — a fixed % per doubling | When the process is stable, usually by the 2nd or 3rd repeat run | 10–25% |
Layer one: one-time engineering. The fastest fall, and the one that ends first
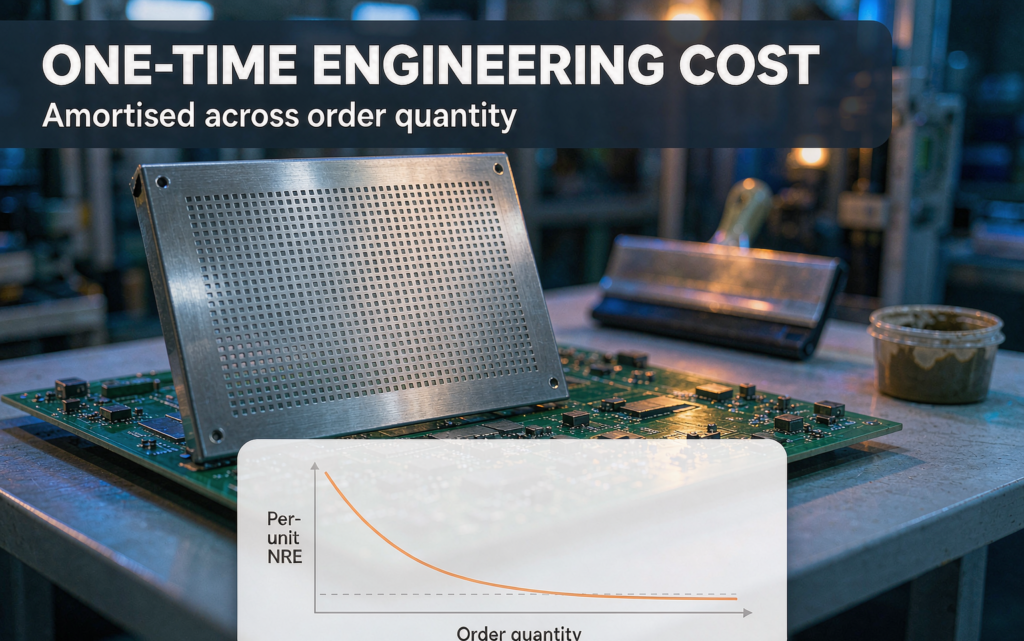
One-time engineering cost (NRE) is every charge a factory incurs once per design regardless of how many boards you order: the solder stencil, the pick-and-place program, the reflow profile, test fixture fabrication and first-article inspection. Because the total is fixed, its per-board contribution is exactly that total divided by the order quantity — which is why it follows a hyperbola and collapses faster than any other layer.
THE AMORTISATION EQUATION
per-board NRE = total engineering cost ÷ order quantity
$12,000 ICT fixture ÷ 500 boards = $24.00 per board
$12,000 ICT fixture ÷ 10,000 boards = $1.20 per board
Same fixture. Same board. The only variable is how many boards you asked for.
Here is the part buyers rarely see, because most quotes fold it into a single line: the items inside NRE are not the same size at all. Four of them are rounding errors at volume. One of them decides your whole curve.
| One-time item | Typical range | Per board at 100 | Per board at 1,000 | Per board at 10,000 |
|---|---|---|---|---|
| SMT stencil (per side) | $30–$150 | $0.30–$1.50 | $0.03–$0.15 | ~$0.00 |
| Pick-and-place programming | $50–$200 | $0.50–$2.00 | $0.05–$0.20 | ~$0.00 |
| Reflow profile development | $50–$100 | $0.50–$1.00 | $0.05–$0.10 | ~$0.00 |
| First-article inspection | $100–$300 | $1.00–$3.00 | $0.10–$0.30 | ~$0.00 |
| ICT test fixture | $2,000–$12,000 | $20–$120 | $2.00–$12.00 | $0.20–$1.20 |
Read that highlighted row again. A test fixture worth $12,000 adds $24 to every board in a 500-piece run — four to eight times what flying-probe testing costs at that quantity. At 10,000 pieces it falls to $1.20 and quietly becomes the cheaper option. The crossover sits in the low thousands of boards, which means the test method on your quote is not a quality decision first. It is a quantity decision, and it is the single largest thing inside NRE.
Layer two: component price breaks. A staircase, not a slope
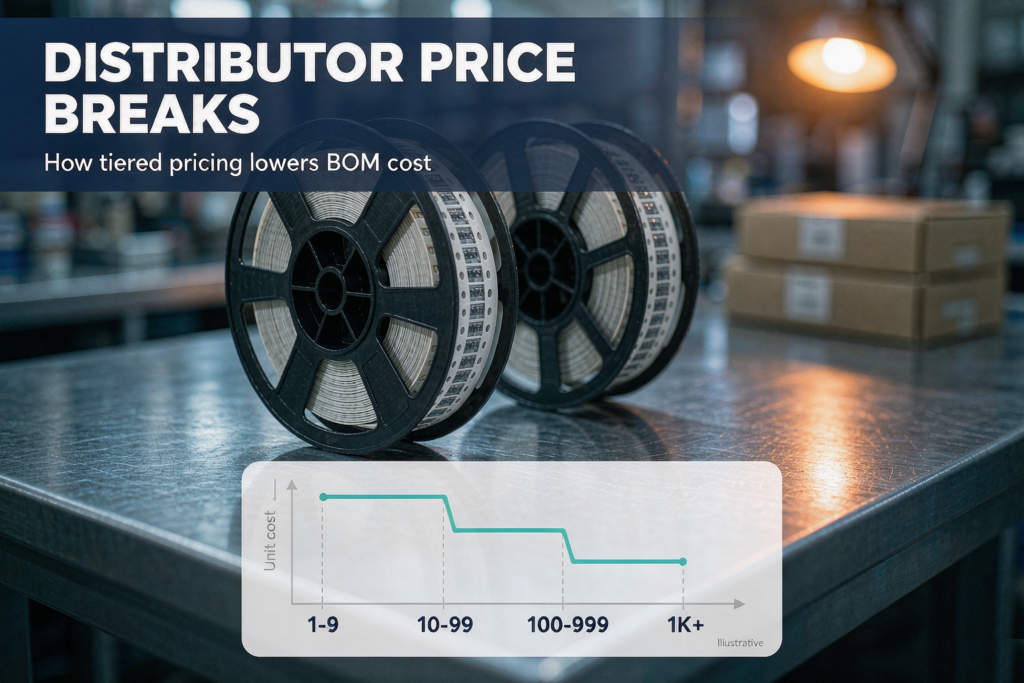
A component price break is a reduced unit price that applies from a defined quantity threshold upward, so the per-part cost does not decline smoothly with volume but drops in discrete steps. Components typically account for 50–70% of a PCBA’s total cost — up to around 80% on boards carrying expensive active devices — which makes this layer the single largest contributor to the total curve on most designs.
Because the tiers are discrete, the interesting number is not the discount. It is what happens at the boundary.
| Quantity tier | Unit price | What you pay | What crossing the boundary actually costs |
|---|---|---|---|
| 1–99 | $12.00 | 99 × $12.00 = $1,188 | — |
| 100–499 | $10.00 | 100 × $10.00 = $1,000 | the 100th unit is effectively free — and you are still $188 ahead |
| 500–999 | $8.50 | 500 × $8.50 = $4,250 | 400 units would cost $4,000 — so the extra 100 cost $250 total |
| 1,000+ | $7.00 | — | the gap between the tiers is where your savings live |
That last row is the whole point of a staircase curve. Buying 100 units costs you $188 less than buying 99. The discount applies to the entire order once you cross the threshold, which creates a band of quantities just below each breakpoint where ordering less is simply irrational. Real components move a lot across those tiers: a connector priced at $1.20 in single quantity is commonly $0.55 at 10,000 pieces, and analog ICs at 1,000–9,999 pieces typically sit 30–50% below their single-piece price, widening to 60–80% above 100,000 pieces.
Component tier pricing usually tracks your annual volume commitment for that part, not the size of a single purchase order. This is why splitting one 5,000-piece order into two 2,500-piece orders often costs exactly the same per board — the tier follows the annual commitment, so the schedule becomes a logistics decision rather than a pricing one.
If you are negotiating component tiers directly, the ladder that suppliers commonly work from scales off the minimum order quantity rather than absolute units: roughly 5–10% at two times MOQ, 10–15% at three to five times, 15–20% at five to ten times, and 20–25% above ten times. Ask which of your BOM lines sit on a tier boundary. One part crossing a threshold can move the total more than a 10% push on every other line.
Layer three: line efficiency and yield. The slowest layer of the three
Manufacturing learning is the reduction in per-unit cost that comes from repetition rather than from spreading a fixed charge: operators get faster, changeovers get shorter, placement programs get optimised, first-pass yield rises and rework falls. It is modelled by the learning curve, in which unit cost falls by a fixed percentage for every doubling of cumulative output — the classic industrial baseline being a 20% reduction.
That 20% figure comes from 1930s airframe manufacturing, where almost everything was done by hand. On a PCBA line the mix is inverted, and the achievable rate drops accordingly.
| Process mix | Cost reduction per doubling of cumulative output | Where a PCBA sits |
|---|---|---|
| 75% manual / 25% machine | 20% | hand assembly, odd-form work |
| 50% manual / 50% machine | 15% | mixed SMT and through-hole lines |
| 25% manual / 75% machine | 10% | most SMT assemblies |
A modern SMT line is machine-paced, which puts most boards in that bottom row. Expect something closer to 10% per doubling than 20% — and expect it to be spread over repeat runs rather than delivered in a single order. Line-level mechanics explain the rest: changeover runs about 10–30 minutes on a high-volume line, 20–60 minutes on a high-mix line, and up to two hours on a new-product-introduction line, with overall equipment effectiveness typically landing between 60% and 88% depending on the line class and the product mix.
The learning curve and economies of scale are different mechanisms and should not be used interchangeably. Economies of scale come from current volume at a single point in time, spreading fixed cost across more units today. The learning curve comes from cumulative volume over time, reflecting everything the line has ever built. The first stops as soon as the fixed cost is fully spread; the second keeps working, slowly, for as long as the same design keeps running.
That distinction explains something buyers notice but rarely get told: a repeat order at the same quantity is often cheaper than the first one was. Nothing about your volume changed. The line simply knows your board now.
Stacking the three layers: what your quote actually traces out
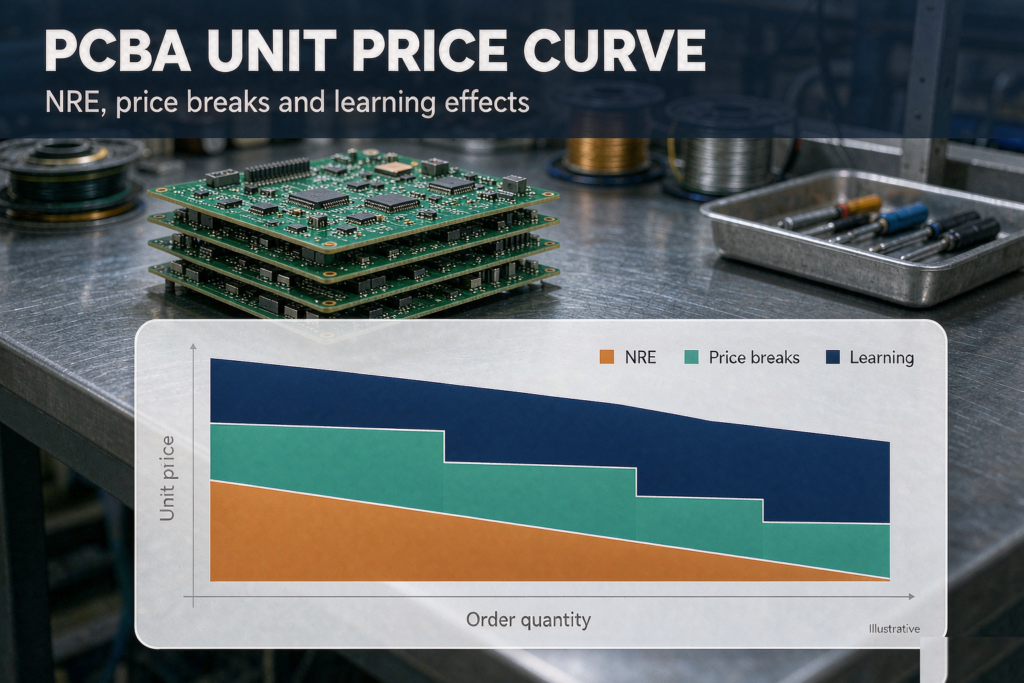
A stacked PCBA price curve separates unit cost into its three layers at each order quantity, which shows which layer is doing the work at each stage. Doing this reveals the practical rule: the first ten-fold increase in volume is an engineering-cost story, the second ten-fold increase is a component-price story, and everything after that is a yield story.
Here is what the decomposition looks like on a mid-complexity board with a modest BOM. Notice how lopsided the first column is, and how quickly it stops mattering.
| Order quantity | One-time engineering / board | Assembly / board | BOM / board | Total / board | vs smallest run |
|---|---|---|---|---|---|
| 5 (prototype) | $60.00 | $15.00 | $12.00 | $87.00 | baseline |
| 50 (low volume) | $6.00 | $8.00 | $10.00 | $24.00 | −72% |
| 500 (mid volume) | $0.60 | $4.00 | $8.00 | $12.60 | −86% |
| 5,000 (high volume) | $0.06 | $2.50 | $6.50 | $9.06 | −90% |
Run the arithmetic on that table and something uncomfortable appears. From 5 pieces to 5,000, the piece price falls $77.94. Of that, $59.94 comes from one-time engineering collapsing (77%), $12.50 comes from assembly and yield (16%), and only $5.50 comes from component price tiers (7%). On this design, the famous “component scale effect” is the smallest of the three. Buyers who spend the whole negotiation on BOM pricing are pushing the weakest lever on the board in front of them.
Now flip the BOM weight, and the picture reverses. This is the single most useful thing to know before you open a quote:
| Design type | BOM share of total cost | Dominant layer, 5 → 5,000 | Where to spend the negotiation |
|---|---|---|---|
| Simple board, low-value BOM | ~20–30% | One-time engineering | NRE line items, test method, minimum charge |
| Industrial control board | ~60–70% | Components and engineering, roughly equal | Annual BOM volume, second sources, panel outline |
| Board with expensive actives (MCU, FPGA, power) | ~75–85% | Components | Component tiers, alternatives, allocation risk |
Industry cost structures put components at 50–70% of a typical PCBA and up to about 80% where the BOM carries expensive active devices, with consumer boards nearer 60–75% and communications or automotive nearer 70–85%. Find your own board on that spectrum before you decide which lever to pull.
So where does the curve stop?
The floor of a PCBA price curve is the cost a factory cannot remove: the components themselves, the bare board, the solder paste, and the minimum machine time your design physically requires. Cost reduction stops not because the factory has stopped improving, but because the remaining cost is no longer a function of how many boards you order — it is a function of what your BOM and your design contain.
Learning-curve theory already has a name for this. It is the plateau model, written as y = max(Kxn, K₀), where K₀ is the minimum achievable cost — the point at which learning ceases because the cost has reached a sufficiently low level. Every PCBA curve is plateau-shaped for the same structural reason: once engineering is digested and the line is stable, only material remains, and material does not care how many boards you ordered this month.
| Order quantity | What is still pushing the price down | Share of the available drop captured | What the next doubling buys |
|---|---|---|---|
| 1–50 | One-time engineering, still 30–50% of the quote | under 35% | large |
| 50–250 | Engineering diluting; components still on low tiers | 35–60% | large |
| 250–1,000 | Component tiers starting to bite; labour stabilising | 60–75% | moderate |
| 1,000–2,500 | Components near their tier floor; labour optimised | 70–80% | small |
| 2,500–10,000 | Everything except material is amortised | 80–90% | single-digit % |
| Above 10,000 | Material only | ~90%+ | negligible unless the BOM changes |
Published quote data shows the shape clearly. Take a 100-component, double-sided, four-layer board with a $250 setup charge: the piece price runs about $56.00 at 10 boards, $38.00 at 50, $31.00 at 100, $27.00 at 500, $25.75 at 1,000 and $24.50 at 5,000. The drop from 10 to 100 is 45%. The drop from 1,000 to 5,000 is 5%. Both are five-fold increases in quantity.
A practical rule for reading your own curve: if a doubling of order quantity buys less than about 5% off the piece price, you have left the steep part. At that point the next conversation should be about the BOM, the board outline or the test method — not about a larger order.
There is a second, less obvious stopping condition. The curve also stops when further volume would require inventory you cannot consume. Committing to 10,000 units to reach a tier price means funding 10,000 units of working capital, paying to store them, and carrying the obsolescence risk if the design changes. A price break is only a saving if the goods get used.
The levers that move the floor — quantity is not one of them
Anything that changes the material line or the minimum machine time moves the floor of the curve itself, which means it keeps paying at every volume. Anything that merely spreads a fixed charge pays once and then stops. Above roughly 1,000 units, design and sourcing decisions therefore outrank order quantity as cost levers.
| Lever | What it actually changes | Quantified impact | Pays low vol. | Pays high vol. |
|---|---|---|---|---|
| Board outline / panel utilisation | Billed panel area, not net board area | Typical utilisation runs 70–85%. A 105 mm board trimmed to 99 mm can add a whole column per panel — roughly a 15% unit price cut. Designing to standard panel grids cuts fabrication 20–40%. | yes | yes |
| Unique part-count consolidation | Feeder changes, extended-part fees, sourcing effort | Extended-part fees commonly run $1.50–$3.00 per additional component type beyond the standard feeder set. A 60-unique-part board is meaningfully cheaper to place than a 120-unique-part board. | partly | yes |
| Test method | Fixture NRE against per-board throughput | A $12,000 ICT fixture is $24.00 per board at 500 and $1.20 at 10,000. Flying probe wins below roughly 1,000 units. | yes | yes |
| Sourcing region | Labour rate and factory overhead | Shenzhen production runs 30–60% below North America or Western Europe on standard designs. Placement rates around $0.01/component against $0.05–$0.10. | no | yes |
| Turnkey vs consignment | A procurement markup against your own buffer stock and allocation risk | A 10–20% markup on an $8,000 BOM is about $960. Consignment adds 15–25% extra component buying for attrition. | varies | varies |
| Removing over-specification | Process steps on the bare board | ENIG runs about 1.15–1.3× OSP. Extra layers, tighter impedance and smaller vias each compound on top of that. | yes | yes |
Look at the “pays at high volume” column. Every one of those six levers is still working when quantity has stopped. That is the practical reason a mature program gets its cost reduction from engineering change rather than from purchase orders.
Where the curve goes back up
A PCBA price curve is not monotonic. It resets upward whenever the underlying inputs change, which is why the same board at the same quantity can quote higher the second time. The common triggers are component allocation, expedited schedules, design revisions, and currency or freight movement — and only one of them has anything to do with the factory’s own pricing.
Component allocation. A part that was in stock when you first asked moves to a 12–20 week lead time, and a simple line item turns into a premium or a substitute. In one documented case, a buyer reordered the same 50 units of the same BOM three months later; the MCU had moved to a 14-week lead time, and the requote came back 18% higher. Nothing about the supplier’s pricing had changed.
Spot buying. Parts bought on the open market during a shortage commonly carry five to ten times the contracted price. A single allocated connector can undo an entire year of tier negotiation.
Expedite. Compressing a normal 10–15 day cycle into 5–7 days typically adds 30–50%. A 24 to 72 hour turnaround can push toward a 200% premium, because the factory has to break its schedule rather than simply work faster.
Design revision. This is the most expensive one and the least discussed. Every revision sets the one-time engineering layer back to full: stencils are re-cut, the placement program is re-optimised, first-article inspection repeats, and first-pass yield starts over from the beginning of its learning curve. It is why locking in production volume before the design is frozen is the most expensive habit in hardware — you pay the engineering layer twice and get the learning-curve benefit once.
Quantity going down, not up. Half the “price increases” buyers complain about are the same curve read at a different point. A requote for 20 units instead of 500 divides the same fixed engineering cost across 25 times fewer boards.
Currency and freight. Exchange-rate moves of 3–5% and peak-season or fuel surcharges shift the landed total even when nothing in the factory changed at all.
Knowing which bucket moved is most of the work when a requote looks wrong. Volatility is not evenly distributed:
| Cost bucket | Typical volatility | What drives the change |
|---|---|---|
| Bare-board fabrication | under 5% per quarter | Layer count, laminate class, surface finish |
| Assembly labour and machine time | low to medium | Placement count, package mix, panel yield |
| Component cost | 10–30% per month | Allocation, distributor stock, spot market |
| One-time engineering | fixed per design | Only the order quantity it is divided across |
Which means a 20% jump on a semiconductor-heavy board is unremarkable, while the same 20% jump on a board built almost entirely from passives and standard connectors is worth questioning line by line.
How to use this on your next quote request
None of the above needs a new tool. It needs a different set of questions, asked before the quote is issued rather than after it looks wrong.
1. Always ask for three quantities. Request 250, 1,000 and 3,000. The shape between the three numbers tells you where you already sit on the curve, and whether a fourth quantity is worth asking for.
2. Ask for the one-time engineering line separately. If setup, stencil, programming and test fixture are folded into the piece price, you have no way to tell whether a price movement came from engineering or from material — and those two need completely different responses.
3. Ask for the component cost basis line by line. Components are 50–70% of the total. On a 100-line BOM, a five-cent difference per part is five dollars per board before a single placement is counted.
4. Ask which test method the quote assumes, and at what quantity it changes. This is usually the largest single item inside one-time engineering, and the one most often defaulted rather than deliberately chosen.
5. Check panel utilisation and unique part count before you chase volume. These two move the floor of the curve. Volume only moves you along it.
6. Do not cross a price break without the inventory arithmetic. Paying $250 for 100 extra units to cross a breakpoint is a bargain. Paying for 5,000 extra units you will not consume is a warehouse plus an obsolescence write-off.
7. If you can commit to only one thing, commit annual BOM volume. Component tiers follow your annual commitment for a part rather than a single purchase order — which makes it the only commitment that survives a design revision.
What the curve looks like from the factory floor
The curve on your quotation and the curve the factory plans against are not the same object. Yours is a price per board at a quantity. Ours is a line with a changeover in it — a slot in a schedule, a feeder setup that either fits the run or does not, and a first-article sign-off that has to happen before anything ships.
Why a minimum charge exists. Below a certain board count, the changeover and first-article work cannot be recovered at any plausible piece price. What you are being quoted at that point is not really a price — it is a share of a setup. This is why very small orders look so disproportionate, and why a factory that removes the engineering fee for prototypes is subsidising the setup deliberately rather than discovering a bargain.
Why we would rather build 2,000 twice than 4,000 once. Two runs let us place your work into gaps in the schedule instead of displacing a committed job, and the second run inherits everything the first one taught us — the same placement program, the same feeder arrangement, the same reflow profile, now proven. That is the log-linear layer of the curve doing its work, and it only works on repeat runs. A single large order gets you the economies of scale; repeated orders get you the learning. If your schedule allows both, take both.
Why a DFM review before the quote changes the floor and not the price. If we look at your board outline and your unique part count before pricing it, the number moves permanently — better panel nesting, fewer feeder changes, a leaner BOM. If we look at it after you have accepted the price, the number does not move at all. The review is the same work either way. Its timing is what determines whether it shows up in your favour.
And one thing no factory can do. We cannot make a material-dominated board cheap. On a design where the BOM is 75–85% of the cost, the only remaining lever is what is inside the material — the part selection, the alternatives, the tier the parts sit on. Every hour spent arguing about the assembly rate on that board is an hour not spent on the only line that can still move.
FAQ
Does PCBA price keep dropping forever as volume increases?
No. The curve flattens once one-time engineering has been amortised and the line is running stably. After that, only the material line remains, and material cost does not fall because you ordered more boards. On most designs, roughly 70–80% of the total available reduction has already been captured by about 1,000 to 2,500 units.
At what quantity does a PCBA price usually stop falling?
For most mid-complexity designs the steep part of the curve ends somewhere between 1,000 and 2,500 units. Beyond that, a doubling of order quantity typically buys single-digit percent. A reliable test on your own quote: if the next doubling saves less than about 5%, you have reached the flat section.
Why is my second quote higher for the same quantity and the same BOM?
Almost always because a component moved. Component pricing swings 10–30% month to month, and a part shifting from in stock to a 12–20 week lead time can lift a quote substantially — one documented case showed an 18% increase on an identical 50-unit reorder after only three months. Ask which BOM lines changed, and compare the engineering, labour and component lines separately rather than the bottom-line total.
Is it cheaper to order 5,000 at once, or 2,500 twice?
It depends on whether 5,000 crosses a component tier that 2,500 does not. Because component tiers usually follow your annual commitment rather than a single purchase order, two orders of 2,500 in the same year often reach the same tier — in which case splitting costs nothing on the BOM side and ties up less working capital. If the larger order does cross a tier, compare the saving against the cost of holding the goods.
What is NRE in PCBA, and why do I pay it again after a design change?
NRE covers the work a factory performs once per design: the solder stencil, the placement program, the reflow profile, test fixture fabrication and first-article inspection. A design revision invalidates all of it — the stencil no longer matches the board, the placement program has to be re-optimised, and first-pass yield restarts from the bottom of its learning curve.
Does buying extra units to reach a price break ever make sense?
Yes — when the saving exceeds the cost of holding the goods. Crossing from 400 to 500 units at a lower tier cost $250 for 100 extra units in one published example, which is worth it if you will consume them. It stops making sense when the extra units tie up cash, occupy storage, or carry obsolescence risk before they are used.
Get your board priced at three quantities, not one
A single number tells you what your board costs. Three numbers tell you where your board sits on the curve — and therefore which lever is still worth pulling. Send us your Gerber files, BOM and coordinate data, and we will come back with the piece price at three volumes, the one-time engineering cost broken out as a separate line, and the test method we would recommend at each volume.
We will also run a DFM and panelisation review before the quote is issued rather than after. On many boards that review moves the floor of the curve — better panel nesting, fewer unique parts, a leaner stackup — which is cost you keep at every volume, not just at the largest one.
Start with our PCB fabrication capability if you need bare boards, or our PCB assembly service if you need turnkey sourcing, SMT and test in one place. If your program is already in volume, ask for annual BOM volume pricing instead of per-order pricing — that is the commitment the component tier actually responds to.
All cost figures in this article are industry-planning ranges and published quote illustrations for typical designs, not quotations for any specific board. Last reviewed October 2026.
About US
You may also be interested in…

About the Author
Andrew Zhan – R&D Engineer at JKRGLO.com
With over 14 years of R&D engineering experience in the PCB industry, Andrew Zhan brings deep expertise in circuit design optimization and DFM implementation. He focuses on translating complex design requirements into production-ready solutions, driving technical innovation for both prototype and mass production.
Working closely with cross-functional teams and clients, he ensures rigorous quality validation and seamless technical communication across the full project lifecycle. Andrew is committed to delivering reliable, high-performance PCB solutions that consistently exceed customer expectations.
Table of Contents
Still, need help? Contact Us:
Need a PCB or PCBA quote?
Tag:
best pcb manufacturers
PCBA
PCB
pcba price by quantity
pcba unit price curve